
% CPU. The app at the top is the cause. Quit it and the fan settles within a minute or two. macOS has no built-in way to see CPU temperature in degrees on Apple silicon; an app like NotchDodo shows it, with fan speed and the busiest app, in your notch.Why your Mac fan gets loud
Fans spin faster to move more air when the chip heats up, and the chip heats up when it's busy. Apple calls the rushing sound "a normal part of the cooling process" during heavy work. The usual reasons, roughly in order of how often we see them:
- A runaway app. A browser tab running a heavy script, a stuck helper process or an app in a loop can hold a full CPU core for hours.
- Heavy work you started. Exporting video, compiling code, running a local AI model or a game. Loud is expected here.
- Spotlight indexing. After a macOS update or moving to a new Mac,
mds_storesandmdworkerindex your files for a while. - Too many browser tabs. Each tab is its own process, so dozens of them add up to a lot of CPU and memory.
- Heat around the Mac. A soft surface like a bed or a lap blocks the vents, and a hot room means less cooling headroom.
If kernel_task shows up at the top, it isn't the culprit. According to Apple, it helps manage CPU temperature by making the CPU less available to the processes using it heavily. It's a symptom: find the app below it.
Method 1: find the app in Activity Monitor
Activity Monitor is built into every Mac and is the quickest way to see what's working your CPU.
- Press Command-Space, type Activity Monitor and press Return. It also lives in Applications → Utilities.
- Click the CPU tab.
- Click the % CPU column header so the busiest process is at the top. Click again if the arrow points the wrong way.
- Watch it for 10 to 20 seconds. Something that stays near the top is your cause; a brief spike usually isn't.
- To quit it, select the process, click the X button in the toolbar and choose Quit. Use Force Quit only if it ignores you.
Also check the Memory tab sorted by Memory. An app that keeps growing makes macOS compress and swap memory, which is more work for the CPU and more heat. For a running graph, choose Window → CPU History. Apple's Activity Monitor guide explains every column.
Method 2: find it from Terminal
If you live in Terminal, top sorted by CPU gives the same answer. Press q to exit:
top -o cpu -n 10For a one-off snapshot you can paste into a chat or a bug report, take two samples (the first one has no CPU rate yet) and keep the second:
top -l 2 -o cpu -n 10 -stats pid,command,cpu,mem | tail -11Or with ps, sorted by CPU, with memory in kilobytes:
ps -Aco pid,pcpu,rss,comm -r | head -11To stop a process from Terminal, use its PID with kill <PID>, which asks it to quit politely. Save kill -9 for processes that ignore that.
How to check CPU temperature and fan speed
Here's the catch: macOS has no built-in app that shows CPU temperature in degrees, and Activity Monitor doesn't show temperature or fan speed at all. What you can get depends on your Mac.
Apple silicon (M1 and later)
The built-in powermetrics tool doesn't report degrees on Apple silicon. It reports the thermal pressure level instead, such as Nominal, which tells you whether macOS has started slowing the chip to cool it:
sudo powermetrics --samplers thermal -n 1 -i 1000Intel Macs
On Intel Macs, the SMC sampler prints the CPU die temperature and fan speed directly:
sudo powermetrics --samplers smc -n 1 -i 1000What counts as normal
Apple doesn't publish a target CPU temperature, and the chip manages itself. On the M5 MacBook Pro we tested, the hottest CPU core read about 40 to 50°C at idle with the fan stopped. Under sustained heavy load, Apple silicon can run in the 90s °C; that's by design, and macOS slows the chip before it gets unsafe. What you control is the room: Apple says to use Mac laptops where the ambient temperature is between 10°C and 35°C.
Fan speed works the same way. On Apple silicon MacBook Pros the fans stop completely when the chip is cool, so silence at idle is normal, and they ramp up gradually under load. MacBook Air models with Apple silicon have no fan at all.
Method 3: see it in your MacBook notch
Activity Monitor answers the question once you go looking. The annoying part is that the fan usually kicks in while you're doing something else. NotchDodo turns the MacBook notch into a small dashboard, and its System Stats tool keeps an eye on this for you.
Runaway app alerts
If an app holds a full CPU core for five minutes, keeps growing in memory, or uses more than 40% of your RAM, the notch shows its icon and the number. It only flags the same app again if things get worse, so a big browser that stays big won't nag you.

Top apps, temperature and fan speed in one panel
Open the notch on System Stats and you get the three apps using the most CPU or memory (one number per app, helpers included) with a Quit button, plus the hottest CPU core in °C and the fan speed beside the CPU gauge. When the fan is resting it says "Fan off".
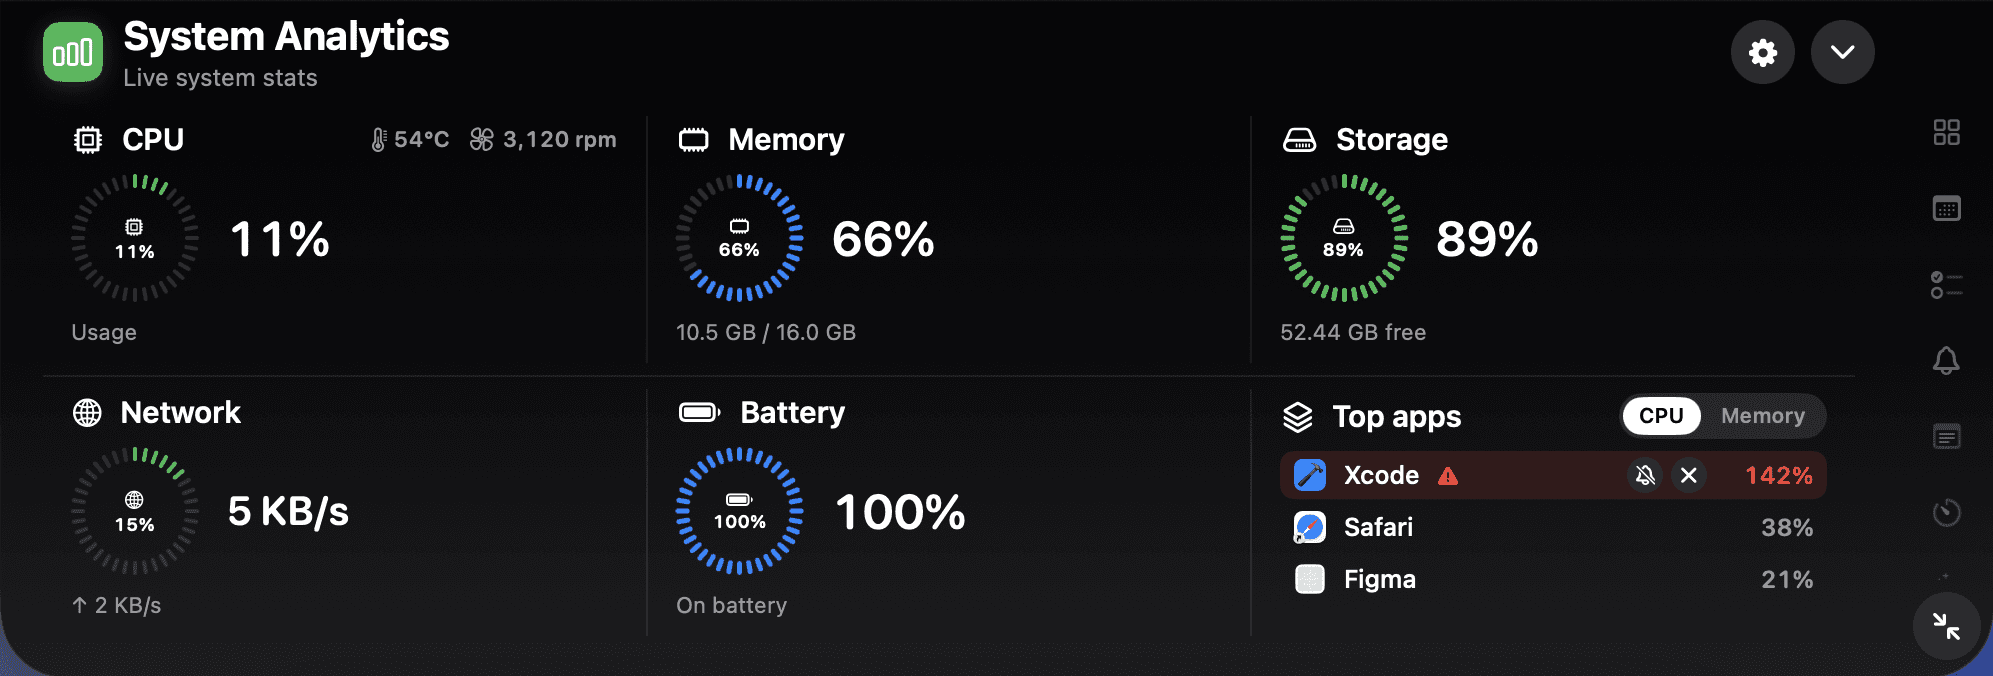
Everything is read on your Mac; nothing is uploaded. Alerts check quietly every 10 seconds and can be turned off in Settings. NotchDodo only reads the fan, it never changes its speed. The same notch also shows your calendar, a Pomodoro timer, clipboard history and Claude Code usage.
How to quiet the fan once you've found the cause
- An app or tab you don't need right now: quit it. In a browser, the browser's own task manager (Chrome: Window → Task Manager) shows which tab is heavy.
- Spotlight indexing: let it finish; it's a one-time job after an update or migration. Leaving the Mac plugged in and awake helps.
- Work you started: loud is normal during an export or build. It settles a minute or two after the job ends.
- Vents blocked: use the Mac on a hard, flat surface such as a desk, as Apple recommends, not a bed or cushion.
- Still loud with nothing busy: on Apple silicon laptops Apple suggests closing and opening the lid or restarting. If the fan stays loud at idle after that, contact Apple Support.
Which method should you use?
| Activity Monitor | Terminal | NotchDodo | |
|---|---|---|---|
| Finds the busy app | Yes | Yes | Yes, and alerts you |
| Groups helpers per app | No | No | Yes |
| CPU temperature in °C | No | Intel only | Yes |
| Fan speed | No | Intel only | Yes |
| Tells you without looking | No | No | Yes, in the notch |
| Quit from the same view | Yes | With kill | Yes |
| Cost | Free, built in | Free, built in | $4.99 one-time |
For a one-time mystery, Activity Monitor is all you need. If it keeps happening, or you want to see temperature and fan speed on an Apple silicon Mac, having the answer waiting in the notch saves you the hunt every time.
More guides
- How to get notified when Claude Code needs your approval on Mac: Three ways to get an alert when Claude Code is waiting for permission or your next prompt on a Mac: the terminal bell, a Claude Code hook with a native macOS notification, and an alert in your MacBook notch.
- Claude Code usage tracker for Mac: See Claude Code tokens, estimated cost and your 5-hour window in the MacBook notch. Reads local logs, uploads nothing. Codex and Gemini CLI too.
- NotchNook alternative: NotchDodo vs NotchNook: An honest side-by-side of the two notch apps: tools, live activities, AI agent tracking, privacy and price.
- NotchDodo vs Boring Notch: What you get with the free, open source Boring Notch and what NotchDodo adds on top: calendar, Pomodoro, Claude Code alerts and more.
Sources
- Apple Support: About fans and fan noise in your Apple product
- Apple Support: If kernel_task is using a large percentage of your Mac CPU
- Apple Support: Keep your Mac laptop within acceptable operating temperatures
- Activity Monitor User Guide: View CPU activity
Mac, MacBook and Activity Monitor are trademarks of Apple Inc. NotchDodo is an independent app and is not affiliated with Apple.